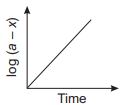
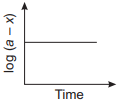
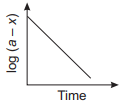
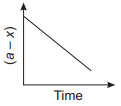
Which one of the following plots is correct for a first order reaction?
Which one of the following plots is correct for a first order reaction?
Solution
Integrated rate equation for first order reaction
$$
k=\frac{2.303}{t} \log \frac{a}{(a-x)}
$$
or
$$
\begin{aligned}
\frac{k}{2.303} t & =\log \frac{a}{(a-x)} \\
& =\log a-\log (a-x)
\end{aligned}
$$
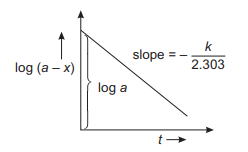
or $\log (a-x)=-\frac{k}{2.303} t+\log a$
Thus, if $\log (a-x)$ values are plotted against time ' $t$ ' the graph obtained should be a straight line.
*