Which of the following graphs correctly represents the variation of particle momentum with associated de…
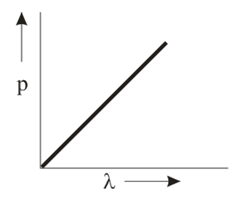
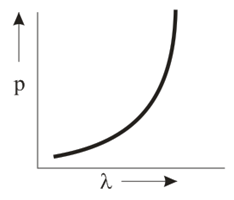
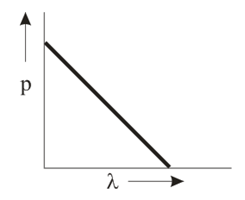
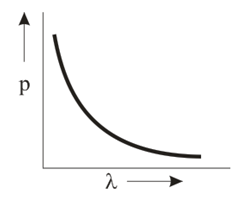
Which of the following graphs correctly represents the variation of particle momentum with associated de Broglie wavelength?
Solution
there is inverse relation between de Broglie wavelength and momentum, hence the graph will be rectangular hyperbola.
~
Asked in: JEE-TOPICTESTS-CHEMISTRY
Practice more STRUCTURE OF ATOM questions on Aicharya