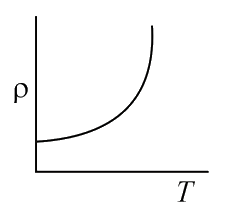
Which of the following graph represents the variation of resistivity ρ with temperature T for copper?
Which of the following graph represents the variation of resistivity with temperature for copper?
Solution
For some metals like copper, resistivity is nearly proportional to temperature although a non linear region always exists at very low temperature.
Relation between resistivity and temperature is given by \(\rho=\rho_{\circ} e^{-a T}\)