Two stones are thrown up simultaneously from the edge of a cliff 240   m high with an initial speed of…
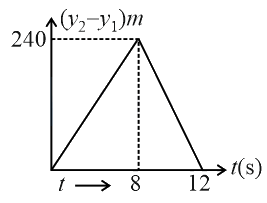
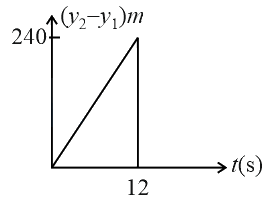
Two stones are thrown up simultaneously from the edge of a cliff high with an initial speed of and respectively. Which of the following graph best represents the time variation of the relative position of the second stone with respect to the first? (Assume stones do not rebound after hitting the ground and neglect air resistance, take )(the figure are schematic and not drawn to scale)
Solution
. When . So, at seconds first stone will reach the ground. . Till , . But after is constant . Relative to stone for ( displacements of stone , . And at seconds stone will reach the ground. The corresponding graph of the relative position of second stone with respect to first is,