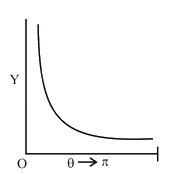
The graph which depicts the results of Rutherford gold foil experiment with α -particles is: θ :…
Scattering angle
Number of scattered -particles detected
(Plots are schematic and not to scale)


Solution
Rutherford carried out an experiment in which he bombarded a thin sheet of gold foil with -particles and then analysed the trajectory of these particles after they collided with the gold foil.
For a detector at a specific angle with respect to the incident beam, the number of particles per unit area striking the detector is given by the Rutherford formula,
Here, Number of incident alpha particles,
Atoms per unit volume in target,
Thickness of target,
Atomic number of target,
Electron charge,
Coulomb's constant,
Distance between target and detector,
Kinetic energy of alpha particles,
Scattering angle.
Therefore,
Asked in: JEE Main 2020 (08 Jan Shift 1)