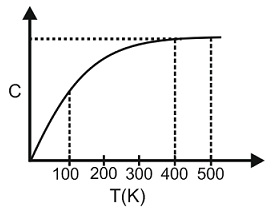
The figure below shows the variation of specific heat capacity ( C ) of a solid as a function of temperature…
- The rate at which heat is absorbed in the range varies linearly with temperature T.
- Heat absorbed in increasing the temperature from is less than the heat required for increasing the temperature from.
- There is no change in the rate of heat absorption in the range .
- The rate of heat absorption increases in the range .
Solution
R = rate of absorption of heat
(i) in
The graph between () appears to be a straight line upto a reasonable approximation.
(ii) as C is more in () then () so heat is increasing.
(iii) C remains constant so there no change in R from ()
(iv) C is increases so R is increases in range ()
Asked in: JEE Advanced 2013 (Paper 2)
Practice more Thermal Properties of Matter questions on Aicharya