The figure indicates the energy level diagram of an atom and the origin of six spectral lines in emission (e.g. line no. arises from the transition from level to ). The following spectral lines will also occur in the absorption spectrum
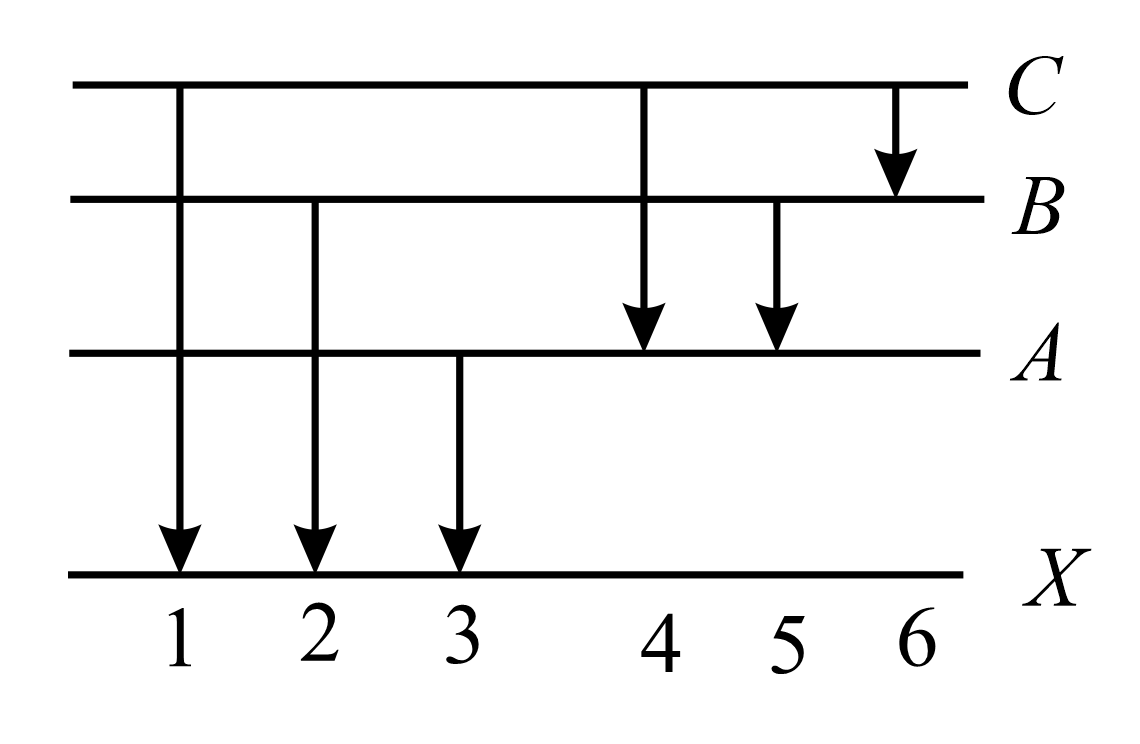
The figure indicates the energy level diagram of an atom and the origin of six spectral lines in emission (e.g. line no. arises from the transition from level to ). The following spectral lines will also occur in the absorption spectrum
.We get absorption lines when the transition of the electron takes place from ground state, or energy level , to higher levels. For given options only and lines.
Asked in: JEE-TOPICTESTS-CHEMISTRY