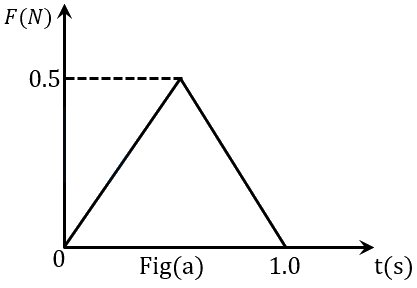
Figures (a), (b), (c) and (d) show variation of force with time.


The impulse is highest in figure.
Figures (a), (b), (c) and (d) show variation of force with time.
The impulse is highest in figure.
As we know, impulse is the area under the curve of the force vs. time graph. So, analysing each figure area under curve.
From above calculations, area under curve in figure (b) is maximum. Thus, fig (b) impulse is highest.
Asked in: JEE Main 2023 (01 Feb Shift 2)
Practice more Center of Mass Momentum and Collision questions on Aicharya