
The - diagram that best describes this cycle is: (Diagrams are schematic and not to scale)


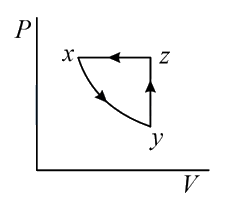
According to the ideal equation,
In the given diagram,
In process , . So, the process is isobaric process.
In process , constant. So, the process is an isochoric process.
In process , constant. So, the process is an isothermal process.
Analyzing using the ideal gas equation in each process, the graph can be drawn as shown below,
Asked in: JEE Main 2020 (08 Jan Shift 1)